For years, Task Manager has been an indispensable part of the Windows operating system, acting as a window into your PC’s inner mechanics. With Windows 11, it’s been revamped with a sleek new design and some nifty features to make managing your computer a breeze.
Even if you’ve dabbled with Task Manager before, there are numerous overlooked features that can grant you better system control. Think Efficiency Mode, memory dump capabilities, tools for keeping tabs on your drive, network data, firmware boot time info, the wait chain analyzer, and even widgets for your desktop. Plus, the ‘always on top’ function is just the tip of the iceberg.
In this guide, I’m going to walk you through several lesser-known tricks so you can maximize what Task Manager offers on Windows 11.
Boost Your Productivity With These Task Manager Tips
Task Manager has received several tweaks, and even seasoned users might miss out on some of its hidden gems. Here are a few to keep an eye on:
Quick Shortcut
While it’s common to access Task Manager from the Taskbar menu, there’s a faster way. Hit "Ctrl + Shift + Esc" on your keyboard to fire it up instantly. Prefer using the Run command or Command Prompt? Just type in "taskmgr" for the same result.
Image credit: Mauro Huculak
Efficiency Mode
Efficiency Mode in Task Manager is all about optimizing performance. By lowering the priority of background processes and focusing resources on what you’re actively using, it helps conserve energy and improve performance, especially on resource-limited devices. To activate this, go to the "Processes" tab, right-click the desired process, select "Efficiency Mode," and confirm. Remember, not every app can use this feature and it’s wise only if you’re comfortable with tweaking priorities.
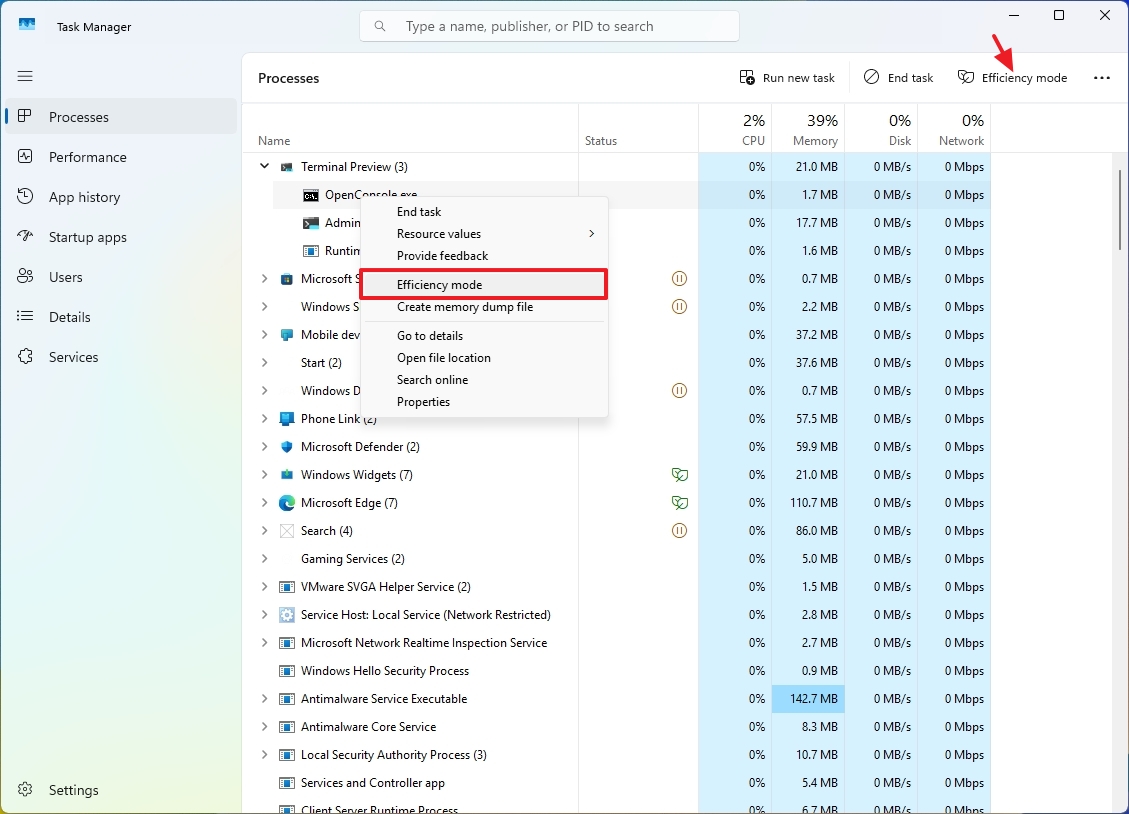
Image credit: Mauro Huculak
Show Command Line
Uncovering the command line in the "Processes" tab might help during troubleshooting. To enable this, right-click the column header in the "Processes" tab and choose "Command line."
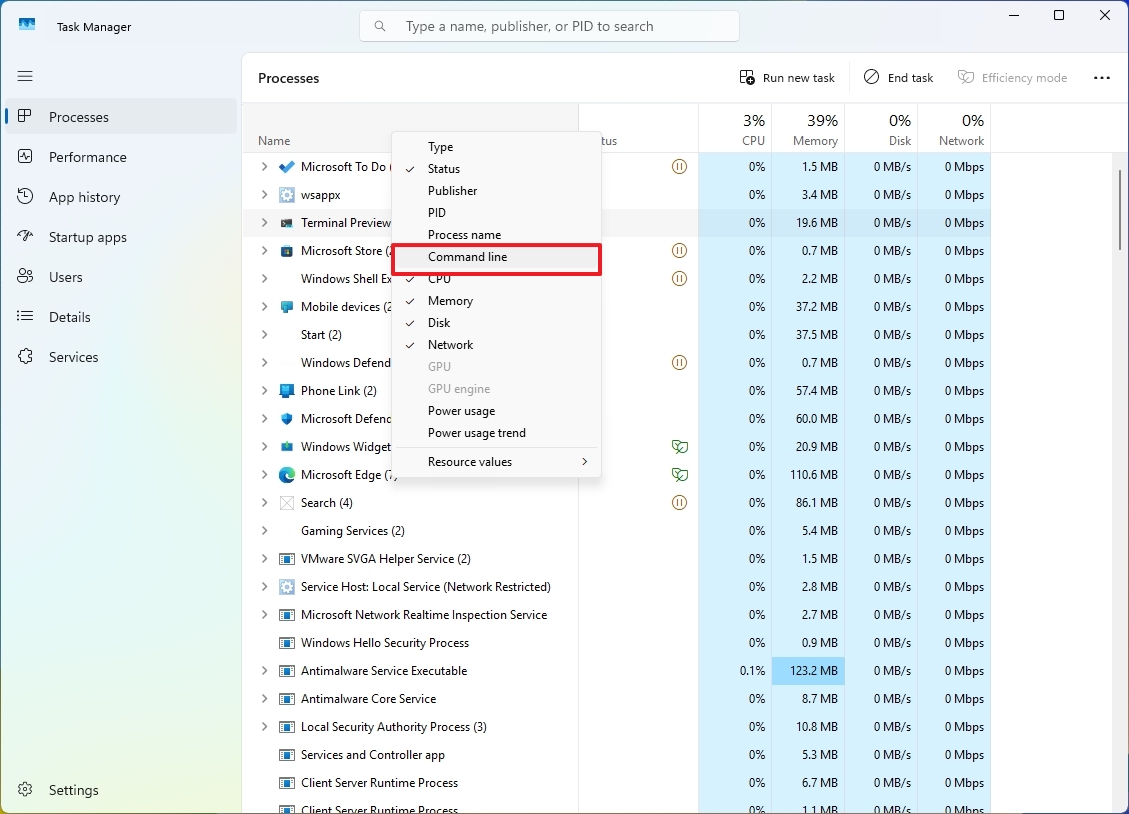
Image credit: Mauro Huculak
Create Memory Dump
Need to diagnose crashes or glitches? Task Manager allows you to create memory dumps—a snapshot of memory at a given time. Right-click the process in the "Processes" tab and choose "Create memory dump file." But be aware, analyzing these requires special tools and expertise.
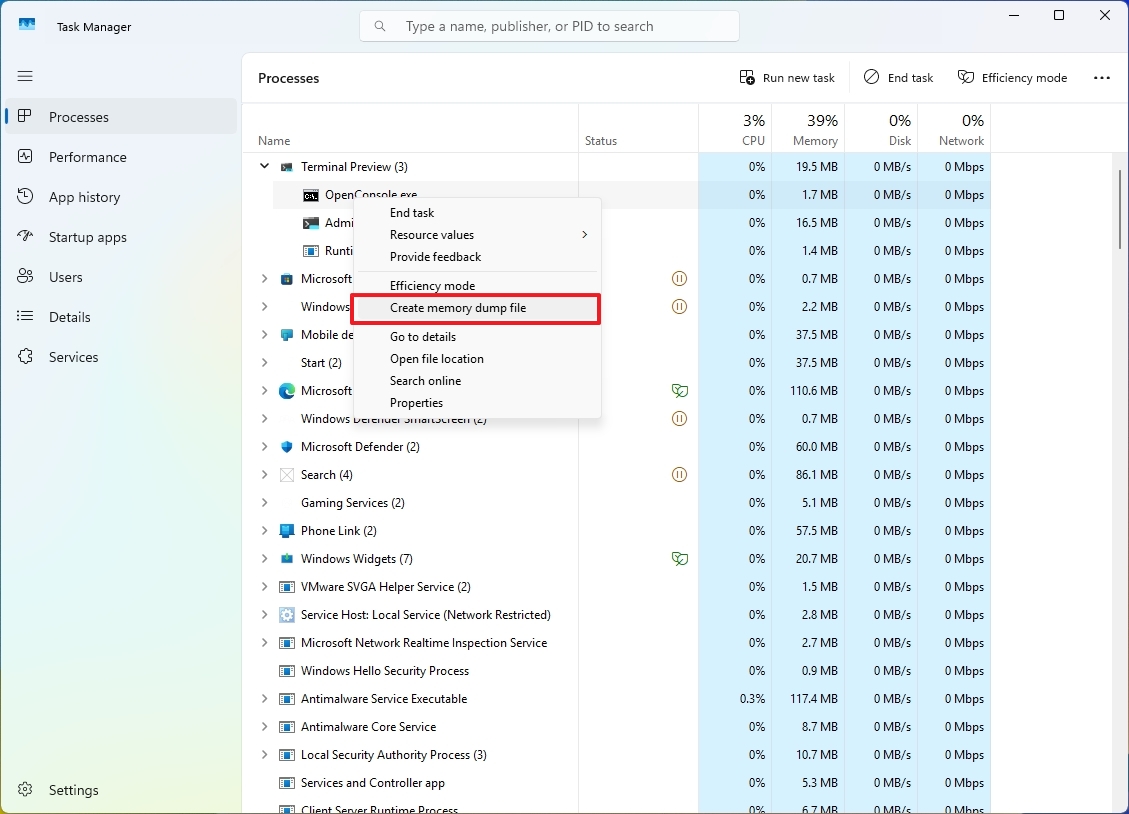
Image credit: Mauro Huculak
Show Every Core in the Processor
The "Performance" tab, under CPU info, typically shows overall processor activity. However, for more granularity, you can view each core separately by right-clicking the CPU graph, selecting "Change graph to," and picking "Logical processors."
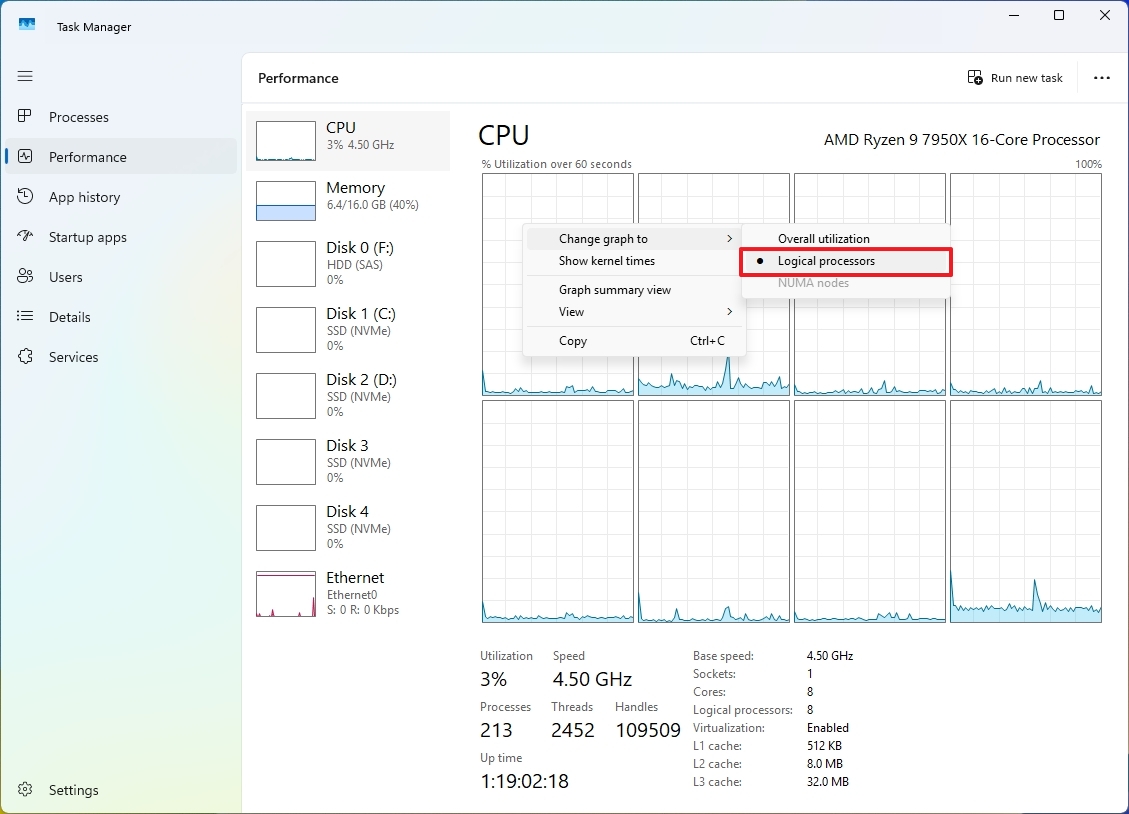
Image credit: Mauro Huculak
Check Graphics Temperature
Monitoring your GPU temperature in the "Performance" tab is crucial, especially for gamers or when using intensive software. Just click the "GPU" tab to find out the temperature. Not all cards may show this, especially older or virtualized ones. Between 65°C to 85°C is typical; sustained temperatures over 100°C indicate overheating.
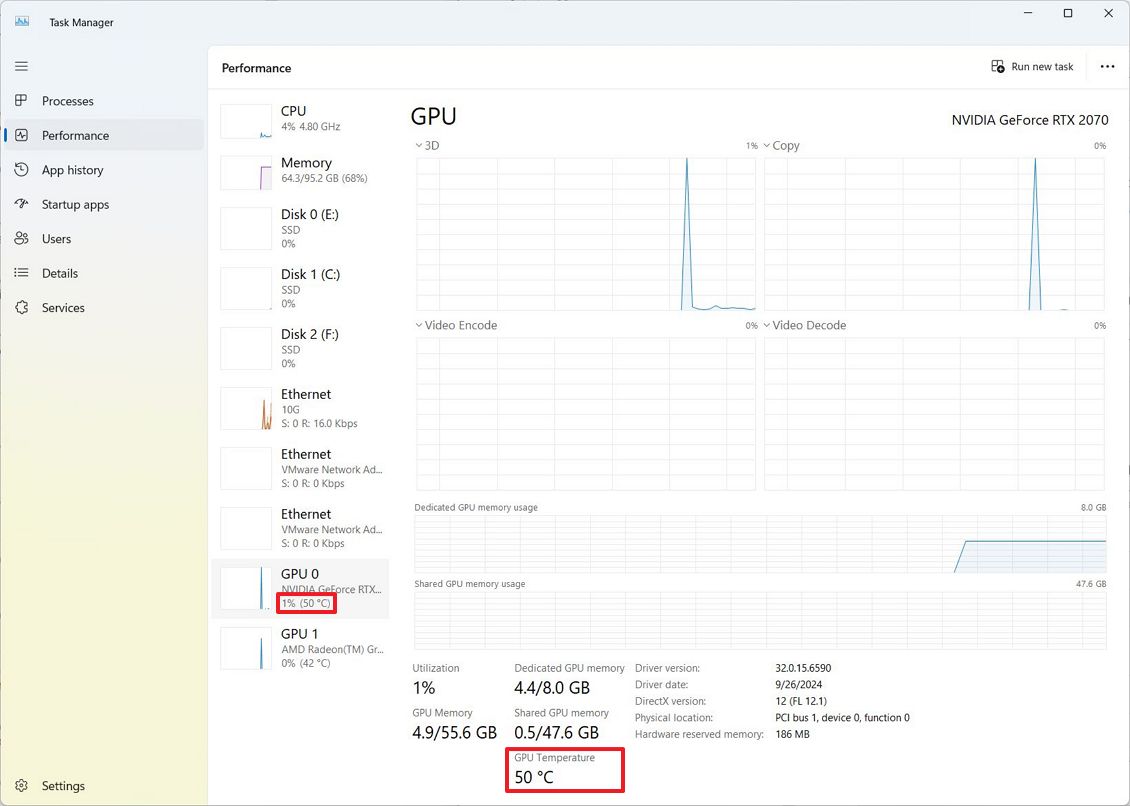
Image credit: Mauro Huculak
Show Network Details
Exploring network adapter activity generally only showcases throughput, but with a little extra digging, Task Manager can reveal details like network utilization. In the "Performance" section, right-click your network graph and choose "View network details."
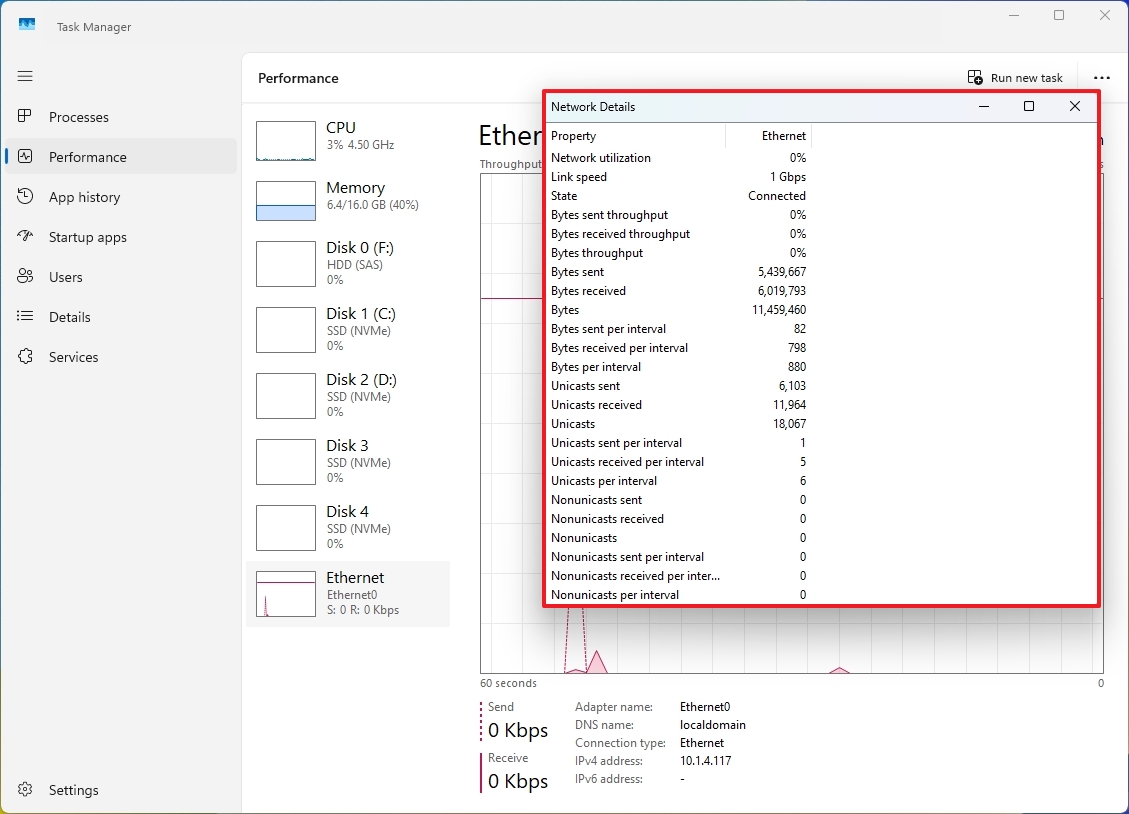
Image credit: Mauro Huculak
Disable Startup Apps
Manage your startup programs directly from Task Manager. Navigate to the "Startup apps" tab, sort by impact, and disable any unnecessary programs to speed up your boot time.
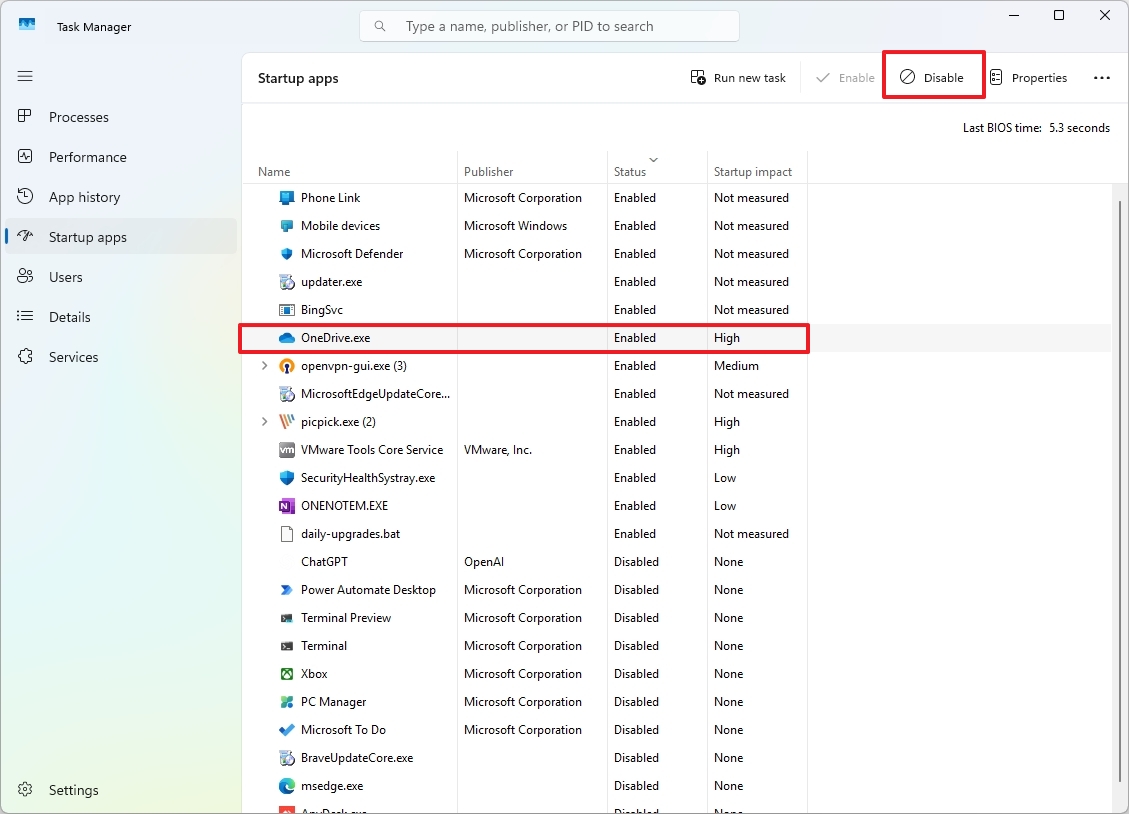
Image credit: Mauro Huculak
Check Boot Speed Time
In the "Startup apps" tab, check the "Last BIOS Time" to see how long your BIOS took to hand control over to Windows. This can help diagnose slow boot issues or for general benchmarking.
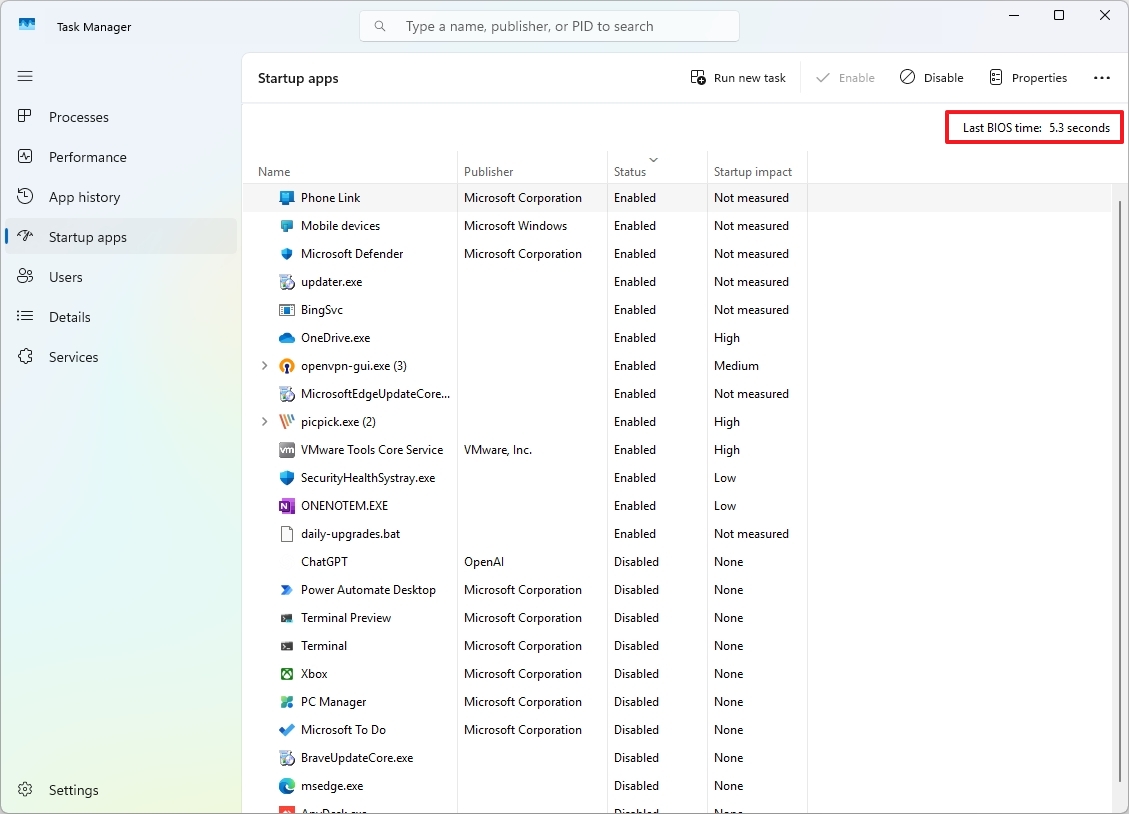
Image credit: Mauro Huculak
Real-Time Drive Monitoring
For those keen on monitoring drive interactions, the "Details" tab can reveal information on "I/O Reads," "I/O Writes," and "I/O Other." To enable this, right-click any column header, select “Select columns,” and pick your desired metrics.
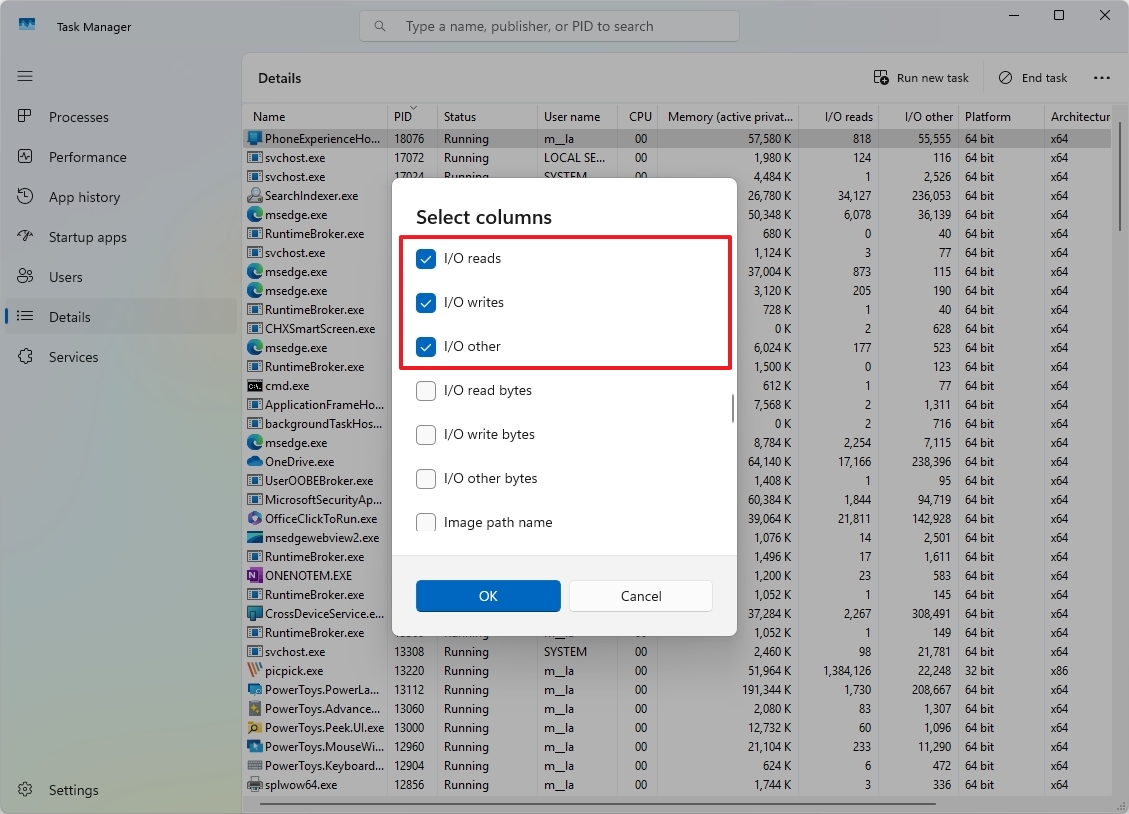
Image credit: Mauro Huculak
Troubleshoot Unresponsive Apps
Encountering a frozen app? Before ending the process, use the "Analyze Wait Chain" to see which processes are causing the hang-up. In the "Details" tab, right-click the problematic app and choose "Analyze Wait Chain."
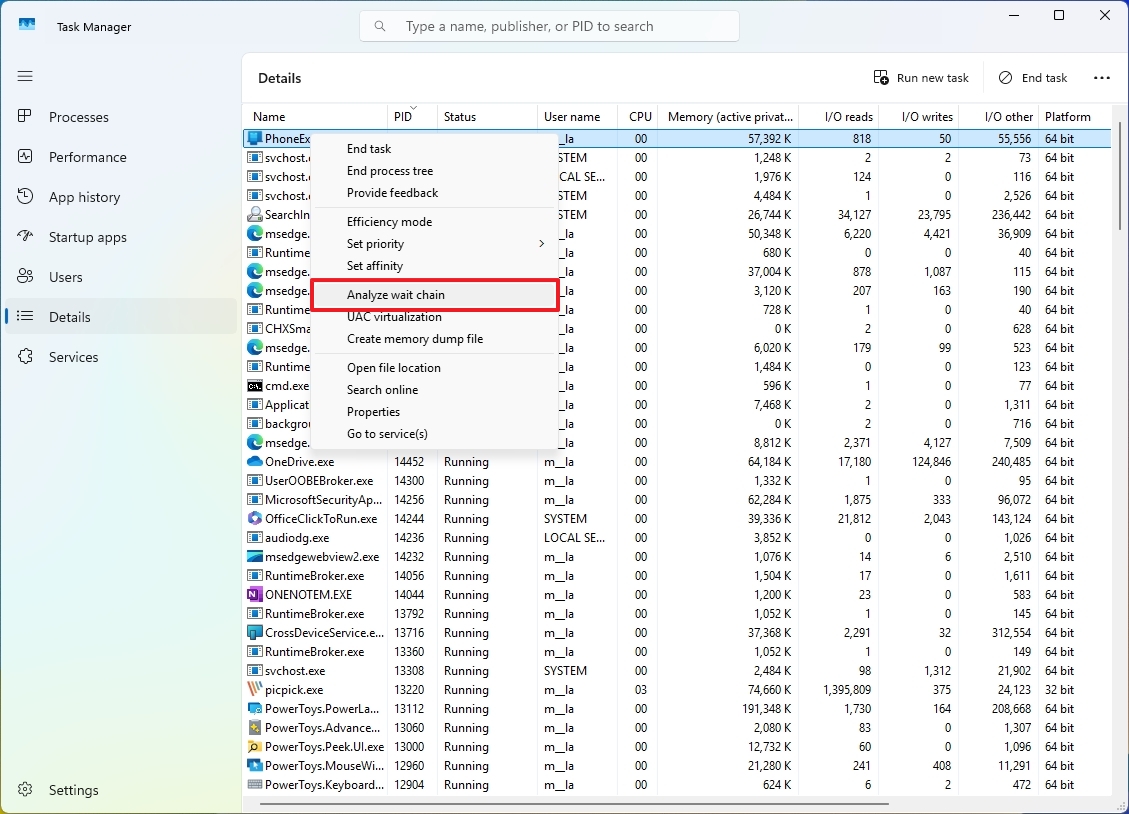
Image credit: Mauro Huculak
Log Off Other Users from Your Account
Need to log someone out? The "Users" tab lets you manage other users’ sessions or services. Simply right-click the user and choose "Disconnect."
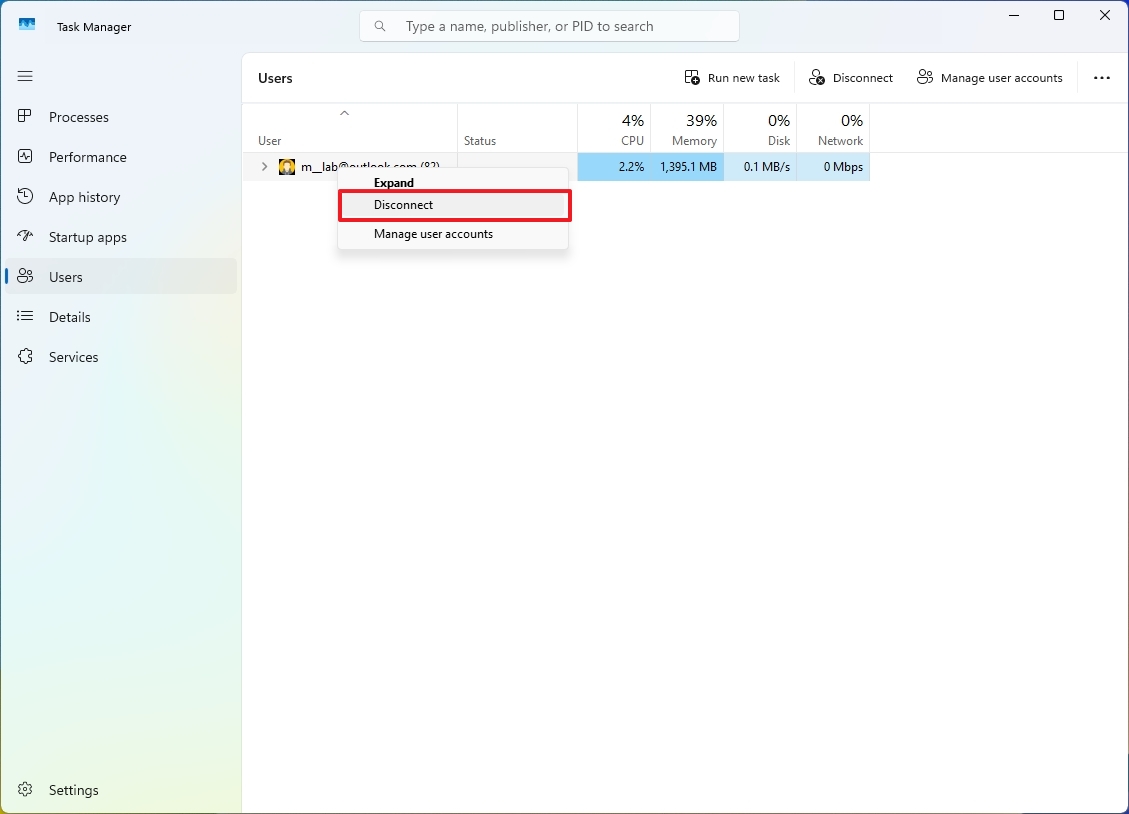
Image credit: Mauro Huculak
Confirm Process Identification
With the Process Identifier (PID) feature, you can pinpoint and even terminate specific processes via commands. The PID is visible in the "Details" tab.
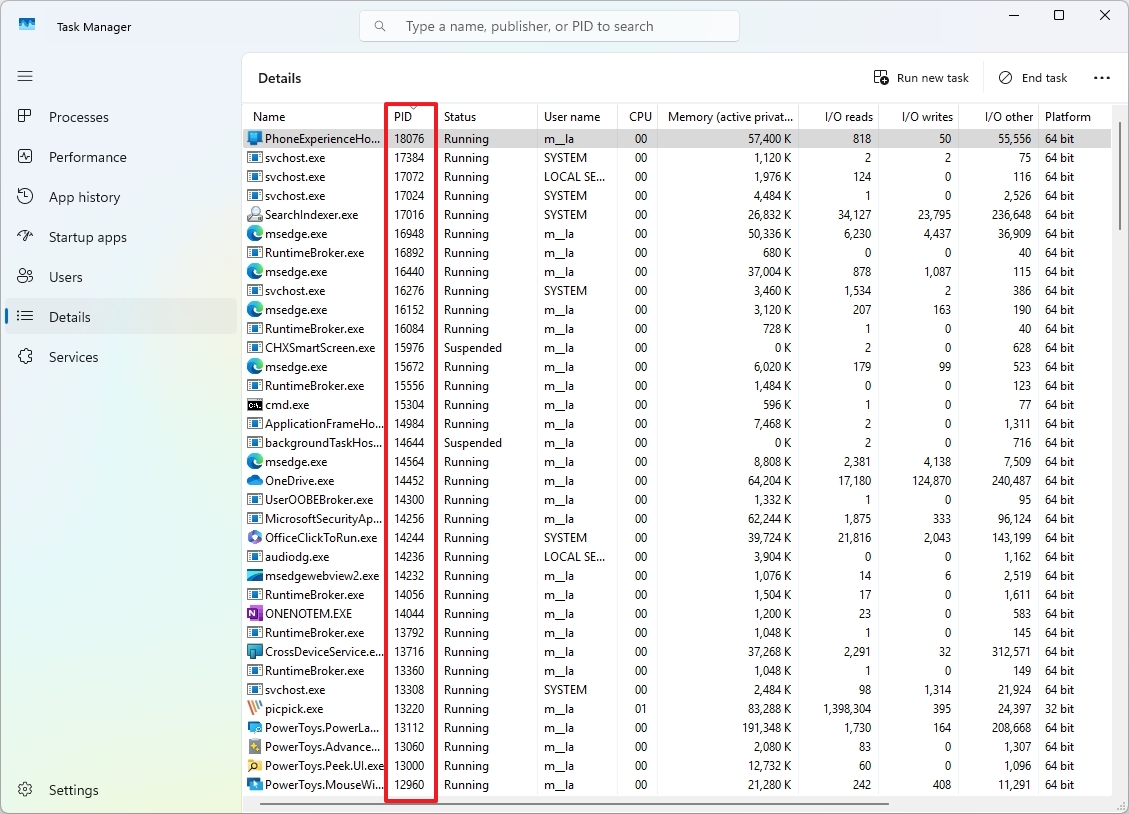
Image credit: Mauro Huculak
Run Apps as Admin
Kick off applications with admin rights easily through Task Manager. Click "Run new task," check "Create this task with administrative privileges," and proceed.
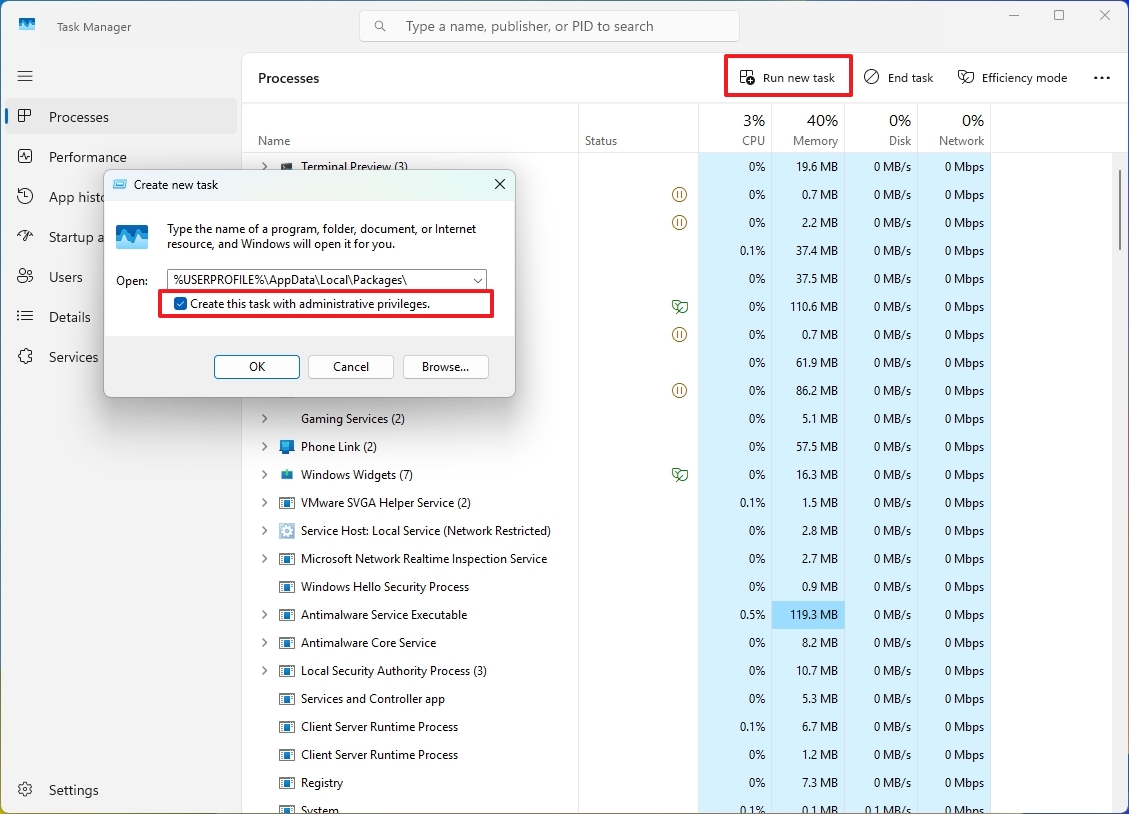
Image credit: Mauro Huculak
Show Always On Top
Keeping your Task Manager window on top of others can be crucial during heavy multitasking. Activate this under "Window management" in the settings.
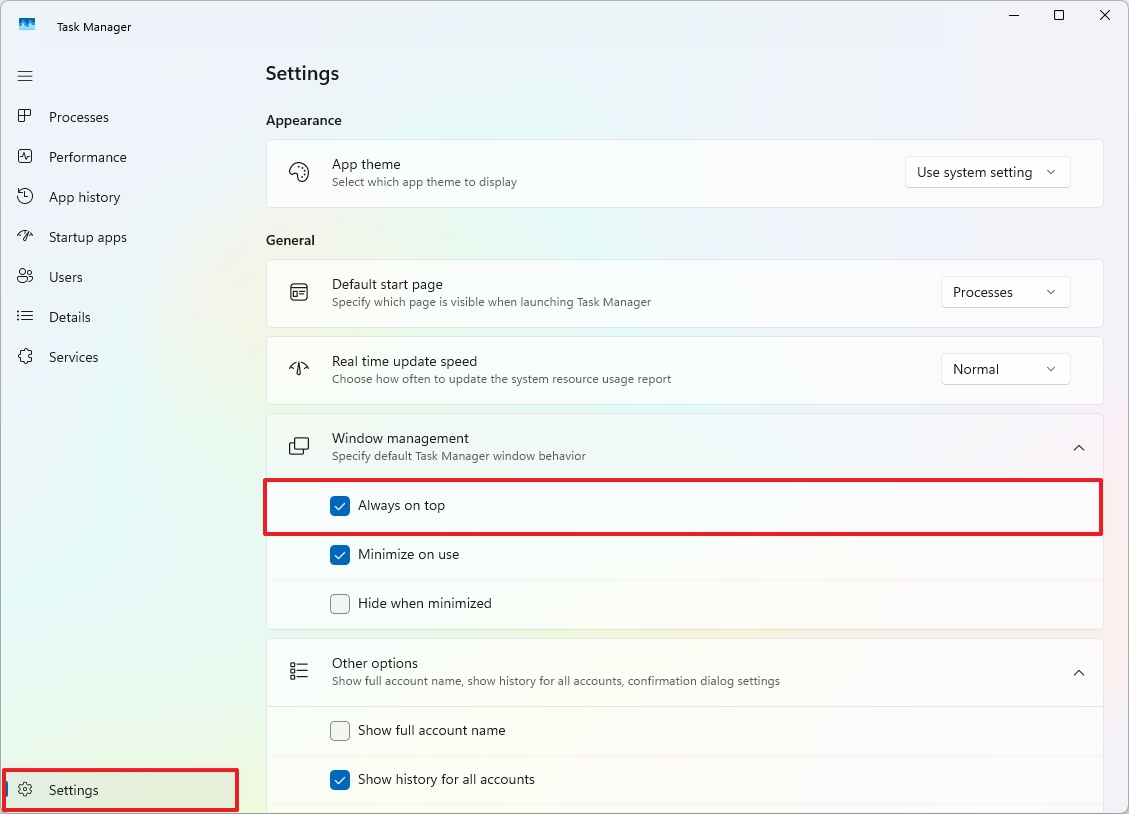
Image credit: Mauro Huculak
Change Default Startup Page
If you frequent a certain Task Manager tab, make it your default view. Change this setting in the "Settings" under "Default start page."
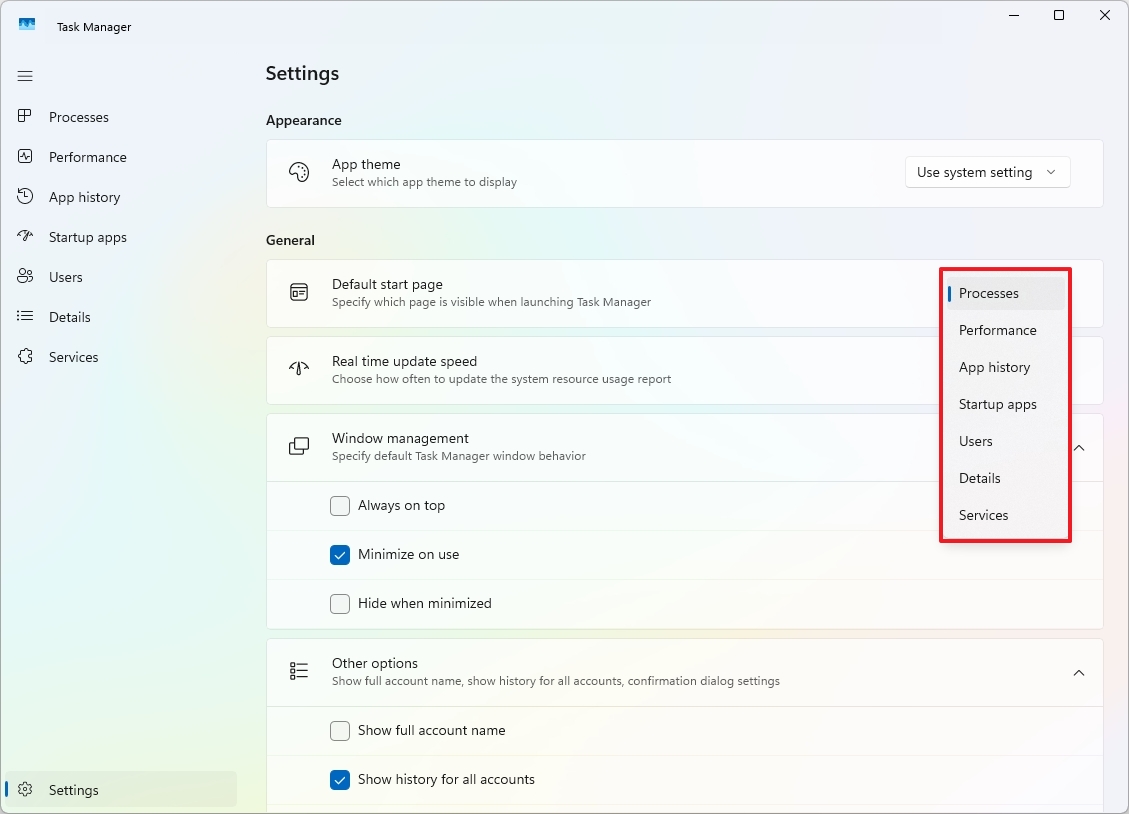
Image credit: Mauro Huculak
Other Useful Shortcuts
Task Manager is equipped with handy keyboard shortcuts, enhancing navigation. Here are a few:
- General: Use the Tab and Ctrl + Tab keys to move through elements or tabs.
- Processes Tab: Hit Spacebar or Enter to manage processes, or Alt + E to toggle "Efficiency Mode."
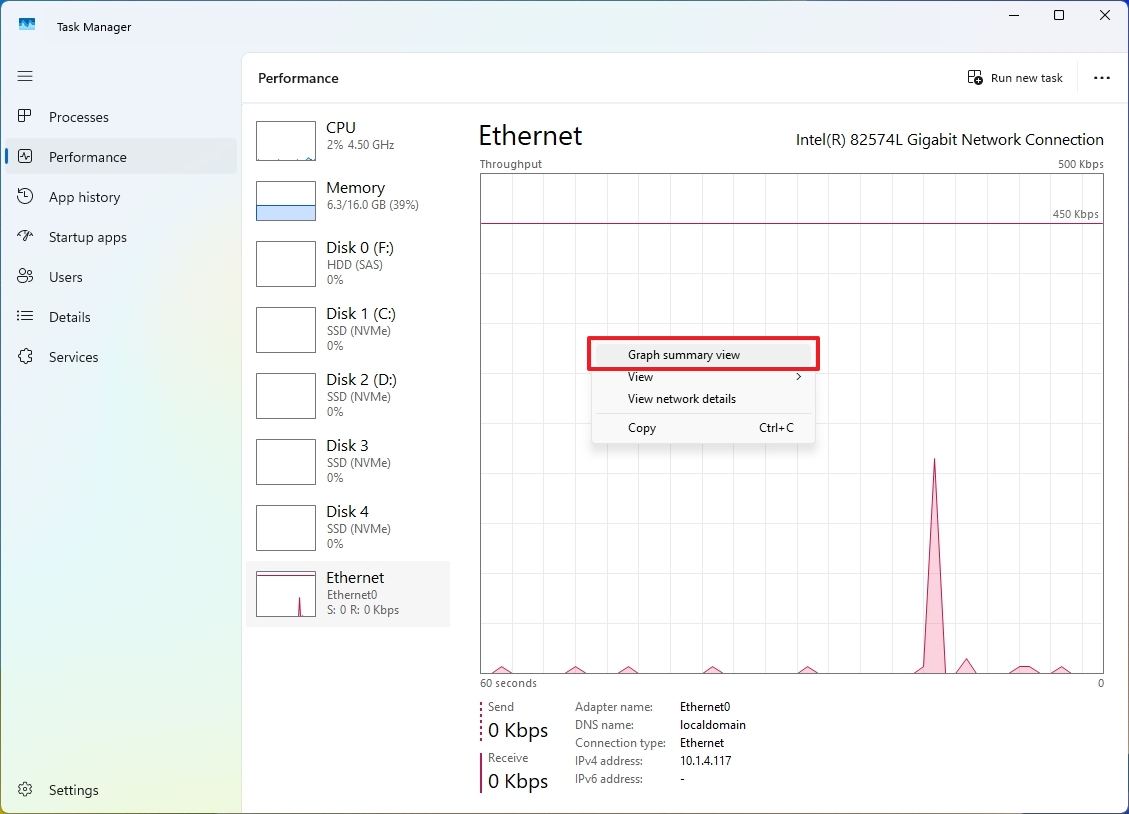
Image credit: Mauro Huculak
Double-clicking any graph can isolate it as a floating widget, handy for live monitoring. Restore it by double-clicking again.
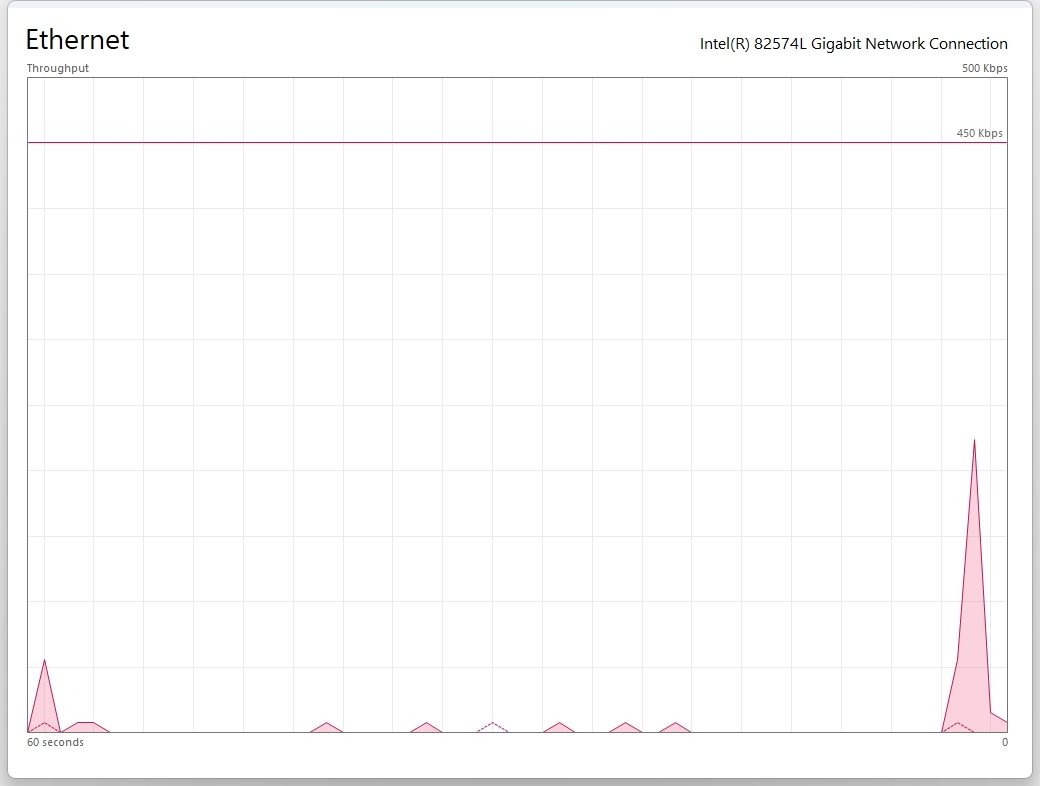
Image credit: Mauro Huculak
More Resources
Looking for more? Dive into these additional resources for detailed insights, support, and the latest updates on Windows 11 and Windows 10.


